Microsoft Power BI has become a leading tool in business intelligence, offering a range of features that transform raw data into actionable insights. Designed for intuitive data analysis, Power BI allows businesses to make well-informed decisions through powerful reporting, visualisation, and real-time analytics.

Here’s a look at the essential Power BI features every data-driven organisation should utilise to stay ahead.
1. Power Query for Data Transformation
Power Query is Power BI’s data preparation tool that streamlines the process of extracting, transforming, and loading (ETL) data. It enables users to automate data-cleaning tasks, filter or pivot data, and make complex data transformations—all without advanced SQL knowledge. This tool helps convert raw data into a structured format ready for analysis, making sure reports and dashboards are based on accurate, consistent data.
Why Use It?
Power Query’s ETL capabilities save time and reduce errors by standardizing and automating data preparation. Businesses working with multiple data sources benefit from reliable, unified data across reports, which boosts accuracy and efficiency.
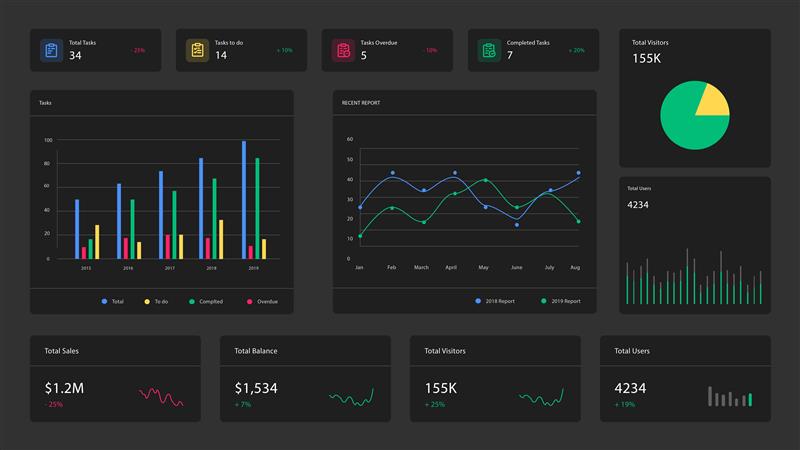
2. Interactive Dashboards and Visualisations
Power BI’s interactive dashboards let users present data insights visually, enabling direct engagement with data. These dashboards allow users to drill down, filter, and interact with visuals in real-time, giving flexibility to explore different data perspectives. In addition to standard charts and graphs, Power BI’s access to custom visuals from Microsoft’s AppSource marketplace enables tailored visualisation that fits specific business needs.
Why Use It?
Interactive dashboards help teams identify trends quickly, enabling a dynamic, hands-on approach to data analysis. Dashboards are also highly effective for presentations and meetings, as stakeholders can easily engage with key insights on the spot.
3. Natural Language Processing (Q&A)
The Q&A feature enables users to interact with data by typing questions in plain language, like “What were last quarter’s sales?” Power BI interprets the question and generates the relevant visualization, making it easy to get specific answers without writing complex queries. The Q&A tool also suggests visual types based on the data, ensuring users get the most accurate and clear representation.
Why Use It?
Q&A democratises access to data insights, making data analysis accessible to everyone—not just the technical team. Executives, marketers, and other non-technical staff can retrieve data-driven answers to specific business questions without needing to navigate complex dashboards or learn query syntax.
4. Data Integration Across Multiple Sources
Power BI integrates seamlessly with a wide range of data sources, including cloud services (like Azure, Salesforce, and Google Analytics) and on-premises databases (like SQL Server). This ability to combine and analyse data from various platforms allows businesses to create a unified, accurate view across departments and systems.
Why Use It?
For organisations relying on multiple data sources, Power BI’s integration capabilities offer a comprehensive view of key metrics, eliminating silos and encouraging data-driven decisions. By centralizing diverse data, businesses can achieve a more holistic analysis, which is invaluable for cross-functional teams.
5. Real-Time Data Monitoring
Power BI’s real-time data streaming enables users to monitor live data, making it ideal for industries that need immediate updates, such as finance, manufacturing, and customer service. By connecting to real-time data feeds, Power BI can display data as it changes, enabling quick responses to shifts in key metrics.
Why Use It?
Real-time monitoring helps businesses stay responsive, addressing potential issues as they arise. This feature is essential for companies that rely on immediate data insights to make timely decisions, such as tracking production metrics, monitoring sales, or providing live customer support.
6. Advanced Analytics with DAX (Data Analysis Expressions)
DAX is Power BI’s formula language, providing advanced analytic capabilities that go beyond standard calculations. It allows users to create custom calculations and aggregations, such as year-over-year comparisons, running totals, and monthly averages, enhancing data depth and precision.
Why Use It?
DAX empowers users to develop tailored insights, enabling data analysts to track complex metrics that align with specific business goals. This feature is valuable for businesses that need in-depth data analysis and custom metrics, providing a competitive edge in data-driven strategy.
7. Row-Level Security (RLS)
Row-Level Security (RLS) allows businesses to manage data access based on user roles. With RLS, specific data views can be restricted to authorized users, ensuring that employees or clients only access the information relevant to them. This feature is especially useful for organisations handling sensitive or proprietary data.
Why Use It?
RLS improves data security by restricting access according to role, protecting sensitive information. It also simplifies the reporting process, as businesses can create a single report with customized views rather than maintaining separate versions for different user groups.
8. Custom Visuals and AI-Powered Insights
Power BI allows for the integration of custom visuals from Microsoft’s AppSource, and it also includes AI-powered analytics tools, such as Key Influencers and Smart Narratives. These tools analyze data patterns, summarise findings, and highlight trends, providing valuable insights at a glance. This combination of visuals and AI analytics helps simplify complex data and uncover hidden insights.
Why Use It?
AI-powered insights make it easier to discover significant data trends and outliers without exhaustive manual analysis. Custom visuals, on the other hand, provide flexibility to present data in formats that best suit specific business needs, aiding in both internal and external communication.
9. Mobile Accessibility for Data on the Go
Power BI’s mobile app provides access to dashboards and reports on smartphones and tablets, ensuring data is accessible wherever users are. The app is optimised for mobile navigation, with responsive visualisations and interactive features tailored for on-the-go analysis.
Why Use It?
Mobile accessibility ensures that decision-makers have up-to-date insights, even when away from the office. This flexibility is especially valuable in today’s increasingly mobile work environment, where remote access to data supports timely decisions and enhances productivity.
10. Collaboration and Sharing Features
Power BI’s collaboration tools make it easy for teams to share reports and dashboards across the organisation. Users can set up workspaces for team projects, publish dashboards to SharePoint, Microsoft Teams, or embed them in other applications. This level of integration fosters a culture of transparency and data-driven collaboration.
Why Use It?
Efficient sharing and collaboration streamline teamwork, allowing departments to view shared insights and work toward common goals. By creating a cohesive, accessible environment, Power BI helps promote data literacy across all teams.
Why Power BI is Essential for Data-Driven Organisations
Features of Power BI—ranging from interactive dashboards and real-time monitoring to advanced analytics and mobile accessibility—make it a versatile tool for businesses that rely on data to drive growth. Organisations that take full advantage of these capabilities can gain valuable insights, improve decision-making, and foster a data-centric culture.
Contact Creative Networks Today
For businesses looking to fully leverage Power BI, partnering with experts can maximise its potential.
At Creative Networks, we specialise in helping businesses harness the power of Power BI for actionable insights and streamlined reporting.
Contact us today to learn how we can tailor Power BI solutions to meet your unique needs and elevate your data strategy.