In today’s era of big data, businesses are more reliant than ever on data visualisation tools to convert vast amounts of raw data into meaningful, actionable insights. These tools enable organisations to make informed decisions, optimise strategies, and stay competitive in a data-driven world. Two of the most popular and powerful platforms in this space are Power BI vs Tableau. Each offers a robust set of features and capabilities, but they cater to different needs and user groups. While both tools excel at transforming data into visual narratives, they do so in distinct ways that make them suitable for different types of businesses and analytical requirements.
This comprehensive guide by Creative Networks will help you understand the key differences between Power BI vs Tableau, including their features, use cases, and pricing, so you can determine which tool is best suited for your business.

What is Power BI?
Power BI is Microsoft’s business analytics service designed to provide interactive visualisations and business intelligence capabilities. It’s particularly appealing for organisations already embedded in the Microsoft ecosystem due to its seamless integration with other Microsoft products.
Key Features of Power BI:
- User-Friendly Interface: Power BI is designed to be accessible, with an intuitive interface that caters to users with varying levels of technical expertise.
- Integration with Microsoft Products: Power BI works effortlessly with Excel, Azure, SQL Server, and other Microsoft services, making data import and analysis straightforward.
- Real-Time Data Access: Power BI supports real-time data streaming, enabling businesses to monitor and analyse data as it happens.
- Custom Visualizations: Users can create custom visuals, providing flexibility in how data is presented.
- Affordability: With competitive pricing, including a free version, Power BI is a cost-effective solution for small to medium-sized businesses.
What is Tableau?
Tableau is a leading data visualisation tool known for its ability to handle large datasets and create highly interactive, detailed dashboards. Tableau is particularly favored by data professionals who require deep, complex analysis and high-quality visualizations.
Key Features of Tableau:
- Advanced Data Visualization: Tableau excels in creating detailed and interactive data visualizations, allowing users to explore data from multiple perspectives.
- Robust Data Handling: Tableau can manage large datasets effectively, making it suitable for enterprises with complex data needs.
- Wide Range of Data Connectors: Tableau connects with a broad array of data sources, including cloud services, big data platforms, and SQL databases.
- Interactive Dashboards: Tableau’s dashboards are highly interactive, enabling users to dive deep into data analysis.
- Strong Community Support: Tableau has an active user community and extensive online resources, including tutorials, forums, and user groups.
Power BI Product Offerings
Power BI offers several products tailored to different needs and business sizes:
- Power BI Desktop
This is a free, standalone desktop application that allows users to create and share reports locally. Power BI Desktop is ideal for individual users who need powerful analytics capabilities without the need for collaboration features. - Power BI Pro
Power BI Pro is a cloud-based service available for approximately £7.50 per user per month. It offers full features, including the ability to share reports, collaborate with other users, and integrate with Microsoft Office 365. This version is well-suited for small to medium-sized businesses that require collaborative analytics tools. - Power BI Premium
Starting at around £3,766 per month, Power BI Premium is designed for large organizations that need advanced analytics capabilities and dedicated cloud resources. This version allows for larger data capacity, AI capabilities, and greater performance, making it ideal for enterprise-level operations. - Power BI Report Server
Power BI Report Server is an on-premises reporting solution included with Power BI Premium. It is perfect for organizations that need to keep their data on-site due to compliance or security concerns. It offers the same capabilities as Power BI Service but is hosted on the company’s own servers. - Power BI Service
Power BI Service is the cloud-based platform that enables users to create, share, and collaborate on reports and dashboards online. This service is included with Power BI Pro and Premium subscriptions, offering a flexible and scalable solution for businesses of all sizes.
Tableau Product Offerings
Tableau provides a variety of products, each tailored to meet the needs of different types of users and organisations:
- Tableau Public
Tableau Public is a free version of Tableau designed for users who want to create and share data visualisations publicly. It is a desktop-based tool, but with one significant limitation: all the work created on Tableau Public is stored in the public cloud, making it accessible to everyone. This version is great for students, hobbyists, or anyone who wants to experiment with Tableau’s capabilities without incurring costs. - Tableau Creator
Tableau Creator is the full-fledged version of Tableau, priced at approximately £55 per user per month. It includes everything needed for data preparation, analysis, and visualization. This version is ideal for data analysts and professionals who need comprehensive tools for data exploration and dashboard creation. Tableau Creator also includes Tableau Desktop, Tableau Prep (for data cleaning and preparation), and a Creator license for Tableau Server or Tableau Online. - Tableau Explorer
Priced at around £35 per user per month, Tableau Explorer is designed for users who don’t need the full range of Tableau Creator’s features but still require the ability to explore data, build dashboards, and perform analysis. It’s ideal for business users who need to interact with data and gain insights but do not require advanced data preparation capabilities. - Tableau Viewer
Tableau Viewer is the most basic paid option, costing approximately £12 per user per month. It’s designed for users who need to view and interact with dashboards created by others. This version is best suited for executives or team members who need to consume data insights without needing to create or manipulate the data themselves. - Tableau Server
Tableau Server is the on-premises solution for sharing, distributing, and collaborating on data visualisations. It’s ideal for organisations that require tight control over their data environment due to security or compliance concerns. Tableau Server allows users to publish dashboards and collaborate with others within their organization securely. - Tableau Online
Tableau Online is the cloud-based version of Tableau Server, offering similar features but hosted on Tableau’s cloud infrastructure. It’s perfect for organizations that want the flexibility of cloud deployment without managing the underlying hardware and software infrastructure.
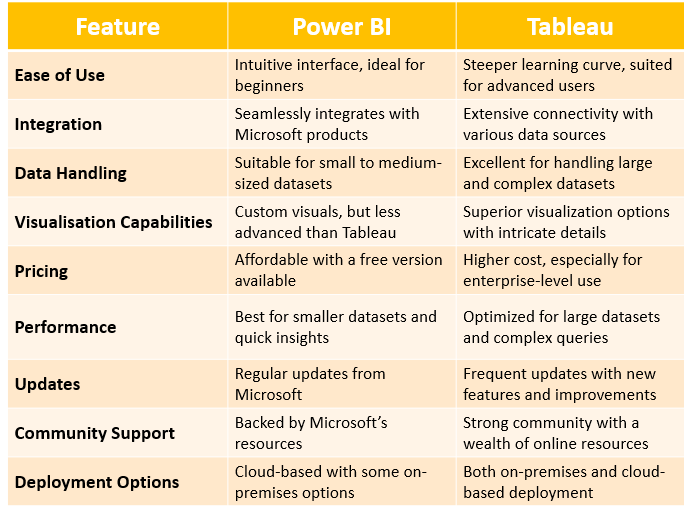
Tableau vs Power BI: Feature Comparison
To better understand the strengths and weaknesses of each tool, let’s compare Power BI and Tableau across several key features.
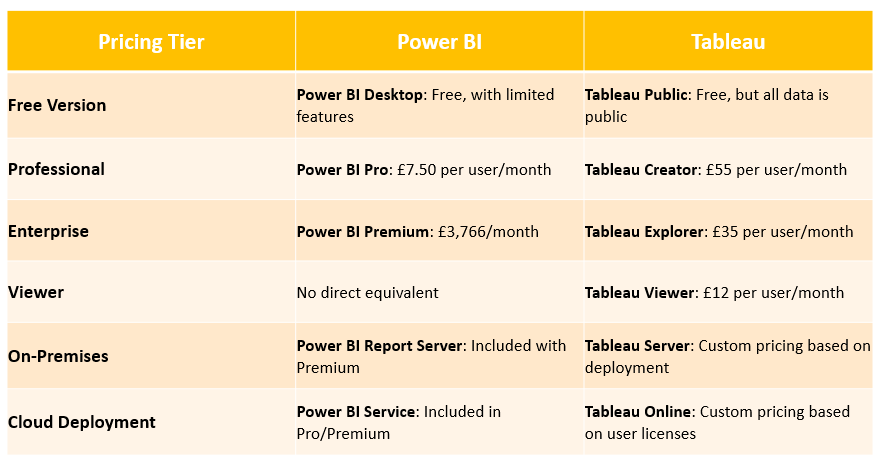
Power BI vs Tableau: Pricing Comparison
Pricing is a significant factor when choosing between Tableau software vs Power BI , especially for businesses operating on a budget. Below is a comparison of their pricing structures.
Which Tool is Right for Your Business? Power BI or Tableau
Choosing between Power BI and Tableau hinges on several key factors, including your organization’s specific needs, budget constraints, and the technical expertise within your team. Each tool excels in different areas, and understanding these nuances will help you make an informed decision.
Power BI is an excellent choice for organizations seeking an affordable, user-friendly solution that integrates seamlessly with Microsoft products like Excel, Azure, and Office 365. Its intuitive interface and strong focus on quick, actionable insights make it ideal for small to medium-sized businesses or teams that need to create and share reports rapidly without a steep learning curve. Power BI’s cost-effectiveness, particularly for businesses already using Microsoft services, is another compelling reason to consider this tool.
Tableau, on the other hand, is a powerful platform designed for enterprises that require more advanced data analysis and in-depth visualizations. It’s the preferred option for organizations dealing with large, complex datasets and for teams that need to perform detailed, sophisticated analysis. Tableau’s superior data handling capabilities, along with its ability to create highly customized and interactive visualizations, make it the go-to choice for data scientists, analysts, and large enterprises that need to dive deep into their data.
Both tools offer unique strengths, and the right choice ultimately depends on how your organization plans to leverage data to drive business outcomes. If your focus is on accessibility, seamless integration with existing tools, and cost-efficiency, Power BI is likely the better fit. Conversely, if your priority is handling large datasets, achieving high-quality visualizations, and conducting complex data analysis, Tableau is the more suitable option.
Contact Creative Networks Today
At Creative Networks, we understand that selecting the right data visualization tool is crucial to your business’s success. Whether you’re leaning towards Power BI or Tableau, our team of experts can guide you through the selection and implementation process, ensuring that you maximize the value of your data analytics investment.
Contact us today to learn more about how we can support your data visualization and business intelligence needs with Power BI, Tableau, or other advanced tools. Let us help you make the most of your data, driving smarter decisions and better business outcomes.